Traceroute Online
Trace the full network path from our server to any destination — seeing every router hop with its IP address, hostname, carrier, country, per-hop latency, and latency delta. Identify exactly where routing bottlenecks, packet loss, and network failures occur along the path. Free, no signup.
Hero, guides, and sidebar links below work without JavaScript. The interactive checker needs JavaScript enabled in your browser.
What Is Traceroute and How Does It Work?
Traceroute (called tracert on Windows and tracepath on some Linux systems) is the most powerful network path diagnostic tool available. While ping tells you whether a host is reachable and the round-trip time, traceroute maps every single router between you and the destination — revealing the complete network topology, identifying exactly which hop introduces latency, and pinpointing where packet loss begins.
Traceroute maps every router between you and a destination — each hop represents a separate network segment, typically operated by a different carrier or organisation
The genius of traceroute is in its use of the TTL (Time To Live) field in IP packets. Every IP packet has a TTL value that counts down at each router. Traceroute exploits this: it sends the first packet with TTL=1. The first router decrements TTL to 0 and is required to send back an ICMP "Time Exceeded" message — revealing its IP address and the round-trip time. Then TTL=2 reveals the second hop, TTL=3 the third, and so on until the destination is reached.
│
▼
Router 1 (TTL → 0) → sends ICMP Time Exceeded back → reveals 192.168.1.1, RTT=1ms
│
▼ (TTL=2 probe)
Router 2 (TTL → 0) → sends ICMP Time Exceeded back → reveals 10.0.0.1, RTT=5ms
│
▼ (TTL=3 probe)
Router 3 (ISP gateway) → ICMP Time Exceeded → 203.x.x.x, RTT=22ms
│
▼ … continues until destination …
│
▼ (final TTL)
Destination → sends ICMP Echo Reply (or Port Unreachable) → TRACE COMPLETE
ICMP vs UDP vs TCP traceroute: The original Unix traceroute sends UDP probes to high-numbered ports. Windows tracert uses ICMP Echo Requests. TCP traceroute (used by tools like tcptraceroute and curl) sends TCP SYN packets on port 80 or 443 — this often passes through firewalls that block ICMP/UDP traceroute probes, giving more complete results for web server paths. Our online tool simulates the traceroute behaviour using HTTP timing measurements from our server.
How to Read Traceroute Results — Every Field Explained
A traceroute result is a table where each row is a router on the path. Here is what every element means and how to interpret each column to diagnose network issues:
Standard Traceroute Output (Linux/macOS)
1 192.168.1.1 (router.local) 1.234 ms ← Home router
2 10.0.0.1 (–) 4.891 ms ← ISP DSLAM / GPON OLT
3 203.0.113.1 (broadband.isp.net) 18.442 ms ← ISP edge router (India)
4 * * * ← Router blocked ICMP (normal)
5 72.14.235.30 (209.85.142.186) 24.105 ms ← Google's India PoP
6 142.250.195.46 (bom12s-in-f14.1e100.net) 26.330 ms ← DESTINATION REACHED
What Each Column Means
- Hop number (#): The sequential position of this router on the path. Hop 1 is always your local router. The total hop count to a destination is a proxy for path efficiency — fewer hops generally means a more direct route.
- IP address: The IP address of the router interface that sent the ICMP Time Exceeded response. Note: this is the router's inbound interface IP, not necessarily the address of its outbound interface.
- Hostname: The reverse DNS (PTR) record for the router IP — often encodes the carrier name, location, and network segment.
ae-1.r02.nchor01.sea.ntt.nettells you it's NTT's router in Seattle. - RTT (Round-Trip Time): The latency to this specific hop. Typically shown as three measurements for reliability. The RTT at the final hop is your overall latency to the destination.
- Delta (latency increase): The difference in RTT between this hop and the previous hop. A large delta (e.g., +80ms) indicates the link between those two hops has high latency — often an international submarine cable crossing.
- Asterisks (* * *): The router did not respond. This is common and does NOT indicate a problem if subsequent hops respond normally. Many carrier-grade routers are configured to drop ICMP time-exceeded messages to reduce CPU load.
Understanding Hop ISP Names in India
When tracerouting from Indian networks, you'll see specific hostname patterns from major Indian carriers in the intermediate hops:
*.jio.comor*.reliancejio.com— Reliance Jio backbone routers*.airtel.netor*.airtelbroadband.in— Bharti Airtel backbone*.bsnl.net.inor*.bsnl.in— BSNL's national backbone*.tatacomm.comor*.tata.net.in— Tata Communications transit network*.sify.net— Sify Technologies*.ntt.net— NTT Communications (common international transit in India)*.telia.net— Telia Carrier (European/international transit)
Interpreting Traceroute Patterns — What Every Result Tells You
Traceroute results follow recognisable patterns that each point to a specific type of network issue. Understanding these patterns turns raw hop data into actionable diagnostic insight:
4 72.14.235.30 24ms (normal)
6 74.x.x.x 142ms (USA) ← cable crossing
2 10.0.0.1 (ISP internal)
9 *.tatacomm.com (Tata transit)
The "Last-Hop High Latency" Pattern
A very common misconception: if the last few hops show very high RTT but the website actually loads fast, don't be alarmed. Destination servers often de-prioritise ICMP responses in favour of serving actual HTTP traffic. The high RTT at the final hop reflects ICMP processing priority, not actual HTTP response time. Always test the service with a real HTTP request (our Ping Test or HTTP Headers tool) to confirm actual service performance.
Reading RTT Deltas to Find Bottlenecks
The most powerful diagnostic technique is looking at the RTT difference between adjacent hops rather than absolute RTT:
1 1ms – Home router (excellent)
2 5ms +4ms ISP local network (normal)
3 22ms +17ms ISP backbone (normal for India domestic)
4 24ms +2ms Minimal increase (healthy transit)
5 140ms +116ms ← MAJOR JUMP — international link identified here
6 145ms +5ms Within US network (normal)
7 150ms +5ms Google PoP (normal)
Conclusion: The 116ms jump at hop 5 is a submarine cable latency.
This is expected and cannot be fixed — it's physics, not a problem.
When to Use Traceroute — 8 Real-World Scenarios
Traceroute vs Ping vs Port Check — Which Tool to Use When
| Tool | What it shows | Use when | Key limitation |
|---|---|---|---|
| Traceroute (this tool) | Every hop on the path with per-hop latency and ISP | Ping succeeds but connection is slow; identifying which hop causes delay; verifying routing paths | Some routers filter ICMP, showing as *; takes 15–30 seconds |
| Ping Test | End-to-end RTT and packet loss to destination | First check: is the host reachable? How fast? | Doesn't show where on path the problem is |
| Port Checker | Whether a specific TCP port is open at destination | Ping works but service is down (web, SSH, database) | Only tests TCP; no path visibility |
| Latency Test | Your browser's round-trip time to our server | Testing your own connection quality | Only tests your connection, not a specific host |
| DNS Lookup | DNS records for a domain | Domain doesn't resolve; checking DNS propagation | Only tests DNS, not actual routing |
Optimal diagnostic sequence: (1) Ping — is the host reachable? (2) If ping works but slow, run Traceroute (this tool) — which hop causes the delay? (3) If ping fails, run Port Check on 80/443 — maybe ICMP is blocked but HTTP works. (4) Check DNS — domain may not resolve correctly. (5) Check Blacklist — mail delivery issues.
Traceroute from the Command Line — Complete Reference
While our online tool runs traceroute from our server, you can also run it from your own device to see the path from your specific network location:
Windows — tracert
tracert google.com
tracert 8.8.8.8
:: Increase max hops (default is 30)
tracert -h 60 google.com
:: Do not resolve hostnames (faster output)
tracert -d google.com
:: Set timeout per hop in milliseconds
tracert -w 1000 google.com
:: Save output to file
tracert google.com > traceroute.txt
:: PowerShell — with more detail
Test-NetConnection -ComputerName google.com -TraceRoute
Linux / macOS — traceroute
traceroute google.com
traceroute 8.8.8.8
# Use ICMP (like Windows tracert)
traceroute -I google.com # or: sudo traceroute -I
# Use TCP SYN on port 443 (best for firewalled paths)
sudo traceroute -T -p 443 google.com
# Set max hops
traceroute -m 40 google.com
# No reverse DNS resolution (faster)
traceroute -n google.com
# Set number of probes per hop (default 3)
traceroute -q 5 google.com
# tracepath — simpler, no root needed
tracepath google.com # Also shows MTU
# mtr — combines ping + traceroute, runs continuously
mtr google.com # Best tool for ongoing monitoring
mtr --report --report-cycles 100 google.com # Non-interactive report
MTR — The Most Powerful Traceroute Tool
MTR (My Traceroute, formerly Matt's Traceroute) combines continuous ping with traceroute, running indefinitely and showing per-hop packet loss and latency statistics that update in real time. It is far superior to a single traceroute for diagnosing intermittent network issues because it reveals packet loss at specific hops that might not be visible in a single-run traceroute:
sudo apt install mtr
# Run interactive MTR
mtr google.com
# Generate a report (100 packets per hop)
mtr --report --report-cycles 100 google.com
# Example MTR output columns:
Host Loss% Snt Last Avg Best Wrst StDev
192.168.1.1 0.0% 100 0.9 0.9 0.7 1.4 0.1
203.0.113.1 (isp.net) 0.0% 100 18.4 18.6 18.1 19.2 0.2
72.14.x.x (google-edge) 15.0% 100 24.1 24.3 23.9 26.1 0.3 ← 15% loss!
142.250.x.x (destination) 0.0% 100 26.1 26.2 25.8 27.0 0.2
# Note: 15% loss at hop 3 but 0% at hop 4 = hop 3 rate-limits ICMP
# This is normal — only loss at FINAL hop indicates real packet loss
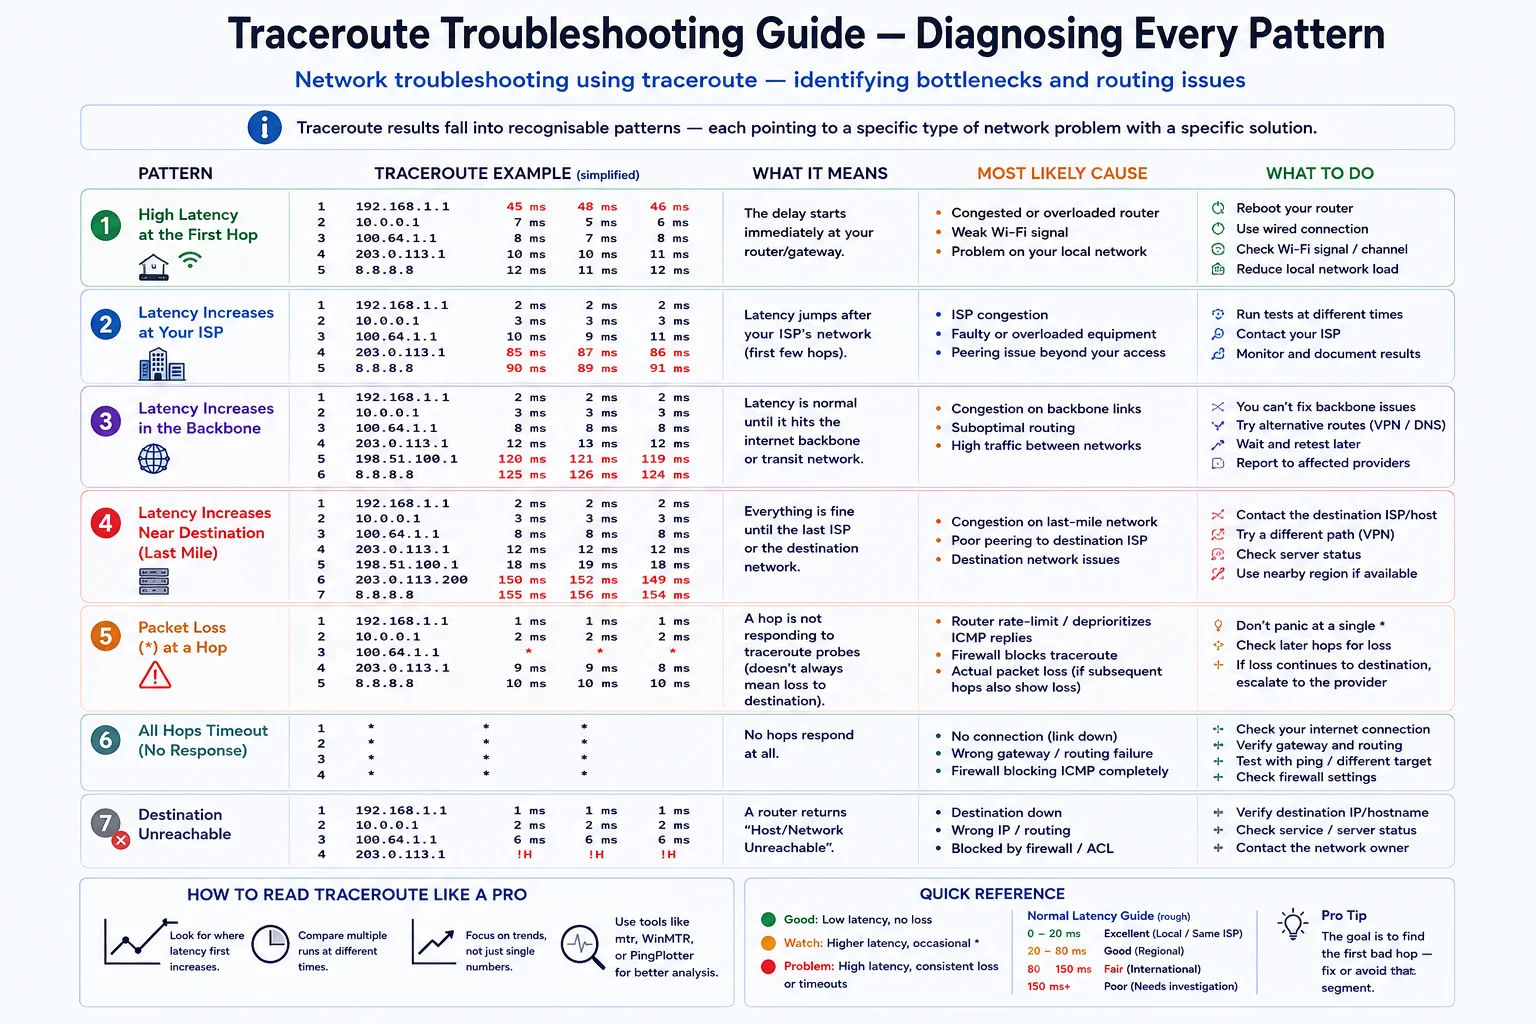
Traceroute Troubleshooting Guide — Diagnosing Every Pattern
Traceroute results fall into recognisable patterns — each pointing to a specific type of network problem with a specific solution
- Your firewall or router may be blocking outbound ICMP probes
- Try TCP traceroute:
sudo traceroute -T -p 80 target.com - On Windows: disable Windows Firewall temporarily and re-test
- Corporate networks often block all ICMP — use a personal connection or VPN
- Verify basic internet connectivity first with a ping test
- Check if the hop country changes at that point — it's likely an international link (expected)
- If both hops are in the same country: check carrier name — carrier handoff (peering) can cause congestion
- If the spike is within your ISP's network (hops 2–5): contact ISP with the traceroute as evidence
- Run traceroute multiple times at different hours — if spike only at peak hours, it's congestion
- Compare with traceroutes from different tools/locations to confirm it's not our server's routing
- Hops respond up to a point then all show * — the destination or a firewall is blocking probes
- The host may still be accessible via HTTP — check with Port Checker on port 80/443
- Try TCP traceroute to bypass firewall ICMP filtering:
traceroute -T -p 443 - AWS/GCP/Azure security groups block ICMP by default — the target may be fully operational
- Use Website Reachability test to confirm actual HTTP connectivity
- Same IP appears multiple times with increasing hop numbers — classic routing loop
- Traceroute will never reach the destination — it will stop at TTL max
- The loop is on your ISP's or a transit network's routing tables
- Report to your ISP immediately with the traceroute output as evidence
- Usually self-corrects within minutes as OSPF/BGP reconverges
- Traffic to a nearby server routes through a distant country (e.g., India → Singapore → India) — "triangle routing"
- Caused by BGP routing policies that prefer certain transit paths regardless of geography
- If this is your ISP routing domestic traffic internationally: contact ISP and request better peering
- Using a CDN (Cloudflare) often forces geographically optimal routing
- For cloud servers: check that you're using a region endpoint close to your users
- Hop 1: Your local router (1–5ms) — any higher suggests Wi-Fi or router issues
- Hops 2–4: ISP's local network (5–30ms) — private IPs (10.x.x.x) are normal here
- Hops 5–8: ISP backbone and peering (20–50ms domestic)
- International link: +100–200ms delta — this is normal for submarine cables
- Final hops at destination: may show high RTT due to ICMP de-prioritisation — check actual HTTP separately
Frequently Asked Questions — Traceroute Online
What does traceroute show?
Traceroute shows every router (hop) between the source and destination on the internet, revealing the complete network path. For each hop, it shows the router's IP address, hostname (from reverse DNS), the round-trip time (RTT) to that hop, and optionally the carrier that owns the IP. The key diagnostic value is that by comparing RTT values between consecutive hops, you can identify exactly where latency increases — pointing directly to which network segment or carrier is responsible for the delay. Traceroute also reveals routing anomalies like suboptimal geographic paths, routing loops, and traffic asymmetry.
What do asterisks (* * *) mean in traceroute?
Asterisks (* * *) in a traceroute result mean that specific router did not send back an ICMP Time Exceeded response — it timed out. This is extremely common and does NOT necessarily indicate a problem. Many backbone routers and carrier-grade equipment are configured to drop or rate-limit ICMP Time Exceeded messages to reduce processing load and avoid being a useful diagnostic target for network mapping. As long as hops after the asterisks continue to respond, the path is working through that router — it's just invisible to traceroute. You should only be concerned about asterisks if they appear at every hop from a certain point onward, indicating a potential blockage or the destination being unreachable.
What is tracert and how is it different from traceroute?
Tracert is simply the Windows version of the traceroute command — the name comes from "trace route" abbreviated differently. Functionally they are nearly identical. The main technical difference: Windows tracert uses ICMP Echo Requests (same as ping), while the original Unix/Linux traceroute uses UDP packets sent to high-numbered ports. The results are typically very similar for most paths. Linux also has traceroute -I (ICMP mode) which behaves identically to Windows tracert. The Windows PowerShell equivalent is Test-NetConnection -TraceRoute. On Linux, mtr (My Traceroute) is generally preferred over traceroute for ongoing diagnostics as it runs continuously and shows packet loss statistics.
Why does traceroute show high latency at the destination but the website loads fine?
This is a common observation and the explanation is straightforward: servers prioritise serving actual HTTP requests over responding to ICMP traceroute probes. When a server is under load, it processes HTTP requests first and queues ICMP responses — this makes the traceroute RTT appear higher than actual HTTP response time. Load balancers and CDN edge nodes in particular often respond to ICMP from a different queue than HTTP traffic. Additionally, some servers respond to ICMP from a different interface or CPU core than HTTP traffic. The correct way to test actual service response time is using our HTTP Headers tool or Ping Test, which measures real HTTP response latency.
How is this online traceroute different from running traceroute on my own machine?
Our online traceroute runs from our server — it shows the network path and routing from our infrastructure to the destination. Your local traceroute runs from your device — it shows your personal path including your home router, ISP local network, and the ISP's backbone routing. Both are valuable but answer different questions. Our tool tells you how the destination is routed from the internet generally. Your local traceroute shows your specific ISP's routing path to that destination. For diagnosing your personal connection issues (e.g., why your gaming latency is high), running traceroute from your own machine is more relevant. For checking if a server is reachable from the internet or verifying a server's routing, our tool is more appropriate.
What is MTR and why is it better than traceroute for diagnosing problems?
MTR (My Traceroute / Matt's Traceroute) is a network diagnostic tool that combines traceroute and ping into a single continuously running test. While traceroute takes a single snapshot of the path, MTR sends continuous probes and computes statistics for each hop: packet loss percentage, minimum/average/maximum/standard deviation RTT. This reveals intermittent problems invisible to a single-run traceroute — for example, a router that drops 5% of packets will only occasionally appear as * in a standard traceroute, but MTR will clearly show "5.0% loss" at that hop consistently. MTR is available on Linux (apt install mtr), macOS (brew install mtr), and Windows (WinMTR). For diagnosing ongoing connection problems, MTR run for 100–200 cycles gives far better diagnostic data than a single traceroute.
What causes routing loops in traceroute?
A routing loop occurs when two or more routers send packets to each other in a circle — each router believes the next hop toward the destination is the other router. In a traceroute, this appears as the same IP address repeating at multiple hop numbers, with the hop count increasing indefinitely without reaching the destination. Routing loops are caused by misconfigured routing tables, BGP route withdrawal without proper convergence, or a failure in dynamic routing protocols (OSPF, EIGRP, BGP) that temporarily creates inconsistent routing tables across the network. They typically self-resolve within seconds to minutes as routing protocols reconverge, but while active they make the affected destination unreachable. TTL prevents packets from circulating forever — they are discarded when TTL reaches 0.
Is this online traceroute tool free?
Yes — completely free, no signup, no account, no API key required. Our online traceroute runs from our server infrastructure and traces up to 30 hops to any destination, showing each hop's IP address, hostname (from reverse DNS), RTT, ISP information, and country. Results include a per-hop visual RTT bar chart and direct links to IP Lookup and other diagnostic tools for each hop. We do not store traceroute results or log the destinations you query.